CultivateU is harnessing data and digital tools to strengthen agricultural decision-making across The Bahamas. By making critical information more accessible, from rainfall patterns to climate trends, we aim to empower farmers, stakeholders, and policymakers with the knowledge they need to adapt, plan, and thrive.
Climate Rainfall Insights
Through a series of easy-to-read infographics, we’re highlighting key climate and rainfall patterns across The Bahamas. From annual totals by island to seasonal variability, these visual tools bring clarity to the environmental factors that shape agriculture in our islands.
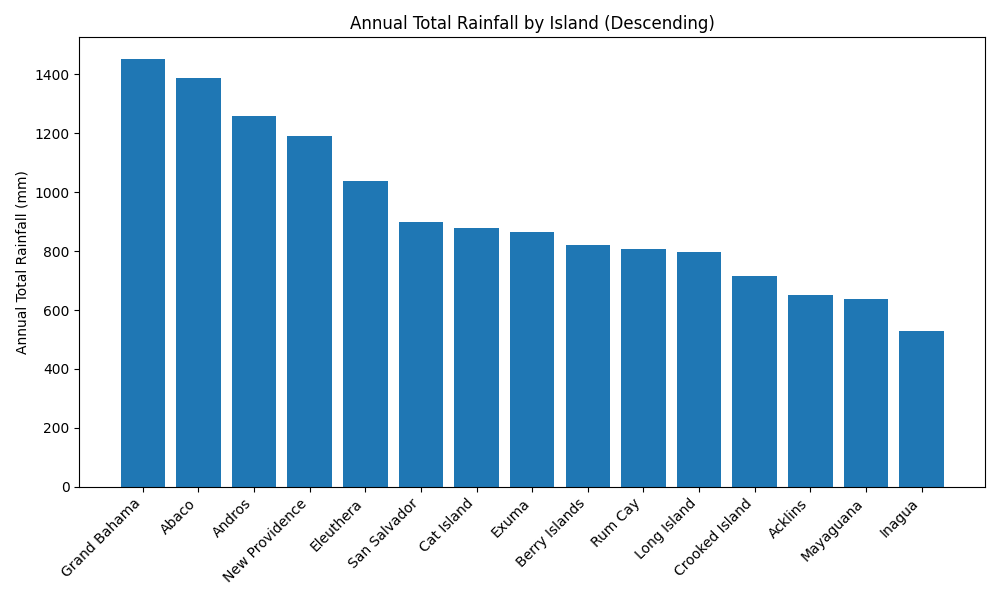
Annual Total Rainfall by Island Bar chart ranking islands from wettest to driest based on total annual rainfal
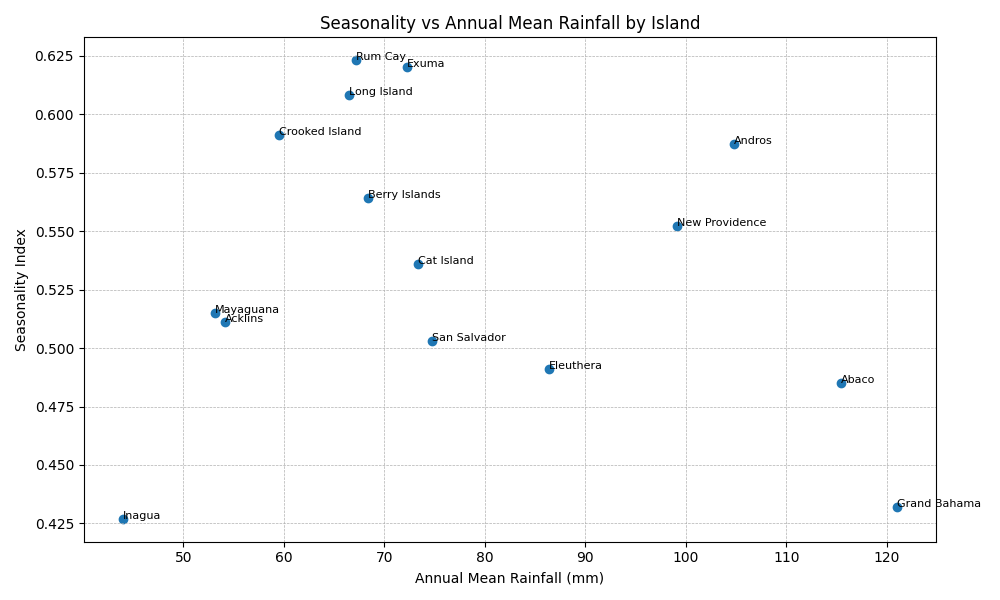
Seasonality vs Annual Mean Rainfall by Island Each point represents an island The x‑axis shows the annual mean rainfall, and the y‑axis shows the seasonality index (higher values = more uneven rainfall distribution)
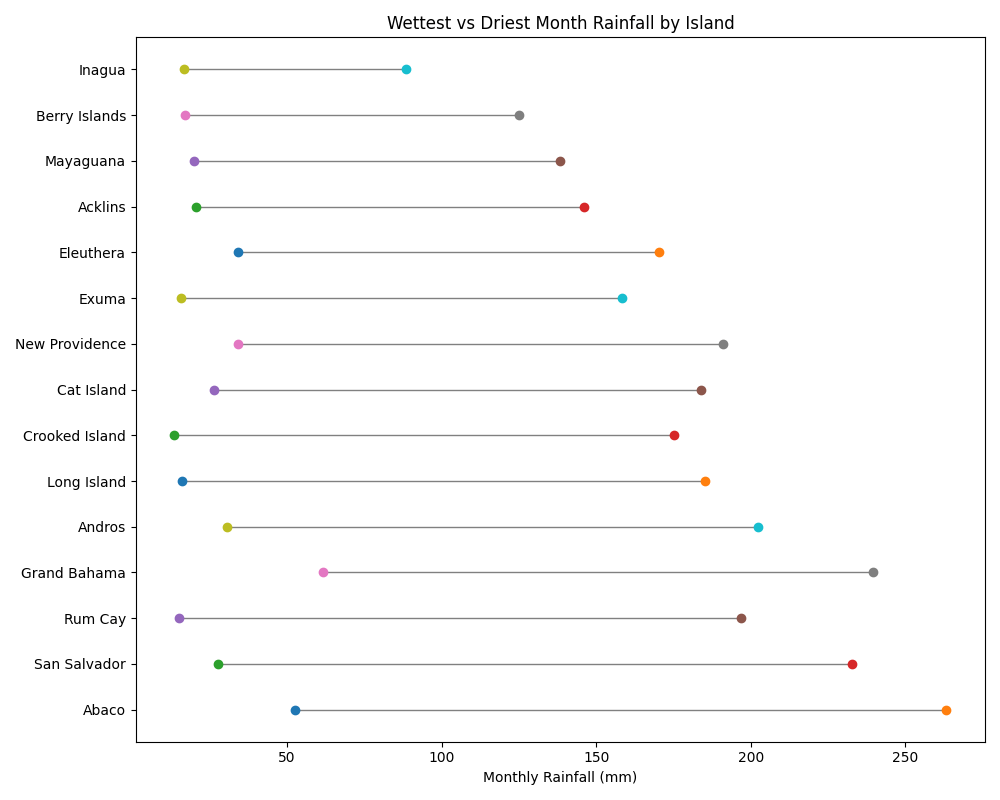
Wettest vs Driest Month Lines connect the rainfall amounts of the wettest and driest months for each island, illustrating the size of the seasonal swing,
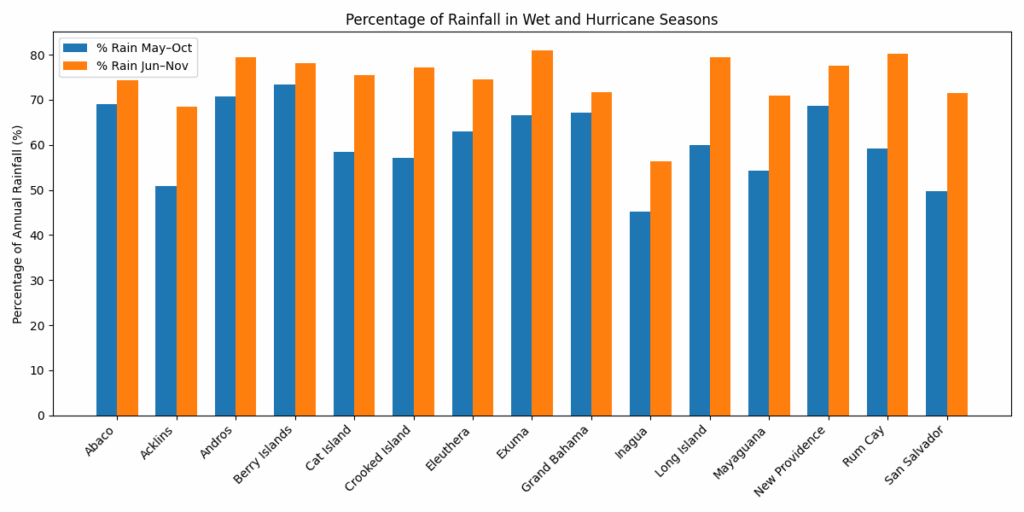
Percent Rain Seasons (percent of rainfall in May-Oct vs Jun-Nov) Grouped bar chart comparing how much of each island’s annual rainfall falls in the wet season (May–Oct) and hurricane season (Jun–Nov)
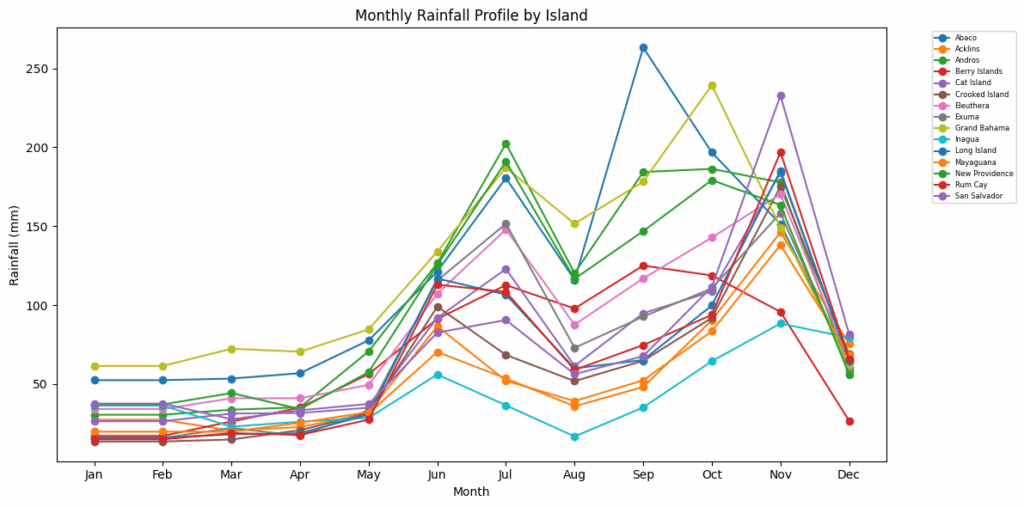
Monthly Rainfall Profiles Multiline chart showing each island’s rainfall month by month, highlighting trends through the year.
Mean Annual Rainfall Map Spatial distribution of annual mean per island
CultivateU Platform
The CultivateU Platform will serve as a central space for farmers, stakeholders, and enthusiasts to access data, resources, and tools that support sustainable growth. Sign up today to be among the first to connect with this dynamic hub.